Subjects
Twenty-eight men (age 25-44) volunteered to participate in the 16-week period strength-training program All subjects were recruited through the Human Test Subject Facility (HTSF) at NASA Johnson Space Center Each subject successfully passed the modified Air Force Class 3 physical and had no history of back pain, hernia or hypertension Also, none of the subjects had participated in a resistance exercise program during the six months prior to the start of the training program The subjects were asked to maintain their normal ambulatory life-style, including diet, supplementary vitamins during the course of the investigation Subjects were asked to refrain from initiating any type of systemic exercise program other than the one prescribed for them as part of this study All participants were informed of potential risks and benefits of the various testing protocols and training and subsequently signed a written informed consent document prior to participation in the study The methods and procedures of this investigation entitled "Comparison of strength training with the ISS Interim Resistance Exercise Device vs free weights", was approved by the NASA-JSC Institutional Review Board on 9/10/98 and renewed on 5/04/00 The Institutional Review Board for Human Subject Research to Baylor College of Medicine & Affiliated Hospitals approved the methods and procedures for the MRI sessions
The subjects were matched by body size (height and weight), age and pre-training strength status, as determined by the maximal lifting load, or one-repetition maximum (1RM) during a dynamic squat The subjects were then randomly assigned into the different groups: 1) control (non-exercising), 2) free weight, 3) iRED 3-set and 4) iRED 6-set
At the beginning of the study all groups consisted of 7 subjects Group assignments and descriptive characteristics of the subjects are presented in Table 1 The exercising subjects were trained in two phases, the first phase groups started training in April/May 2000, the second-phase groups started late 2000/ early 2001
Bruce Treadmill Screening
In order to reveal potential cardiovascular abnormalities that would limit the ability of the subject to participate in the investigation, all subjects underwent a maximal treadmill exercise test prior to participation in the study The Bruce treadmill screening was performed on a Quinton Q65 motor-driven treadmill, using an incline protocol
The Bruce, Kusumi and Hosmer (1973) maximal exercise protocol is a standardized multi-staged treadmill protocol, during which the workload is increased by changing both the treadmills velocity and inclination The test would last until voluntary exhaustion Typically, the exercising phase of the test lasted 10-15 minutes
Blood pressure and ECG measurements were obtained while the subject was resting supine, supine while hyperventilating, and standing, using the CQ 500 treadmill controller and ECG apparatus During the maximal exercise test, blood pressure was measured once during each stage and ECG was monitored continuously ECG and blood pressure measurements were also obtained during the recovery phase of the maximal exercise test
During the test procedure, two test operators and one physician were present in the room
Training Equipment
In this study, the 1 repetition maximum (1RM) was used to quantify the subjects maximal dynamic strength for each exercise and to determine the individual training intensities to be used during the training sessions (Baechle and Earle, 1994) 1RM values were obtained with free weights (standard Olympic weights) for squats, heel raises and dead lifts The squats and heel raises were performed on a Smiths Machine (Bigger, Faster, Stronger 3000052, Salt Lake City, UT) The Smith Machine consists of a metal rack with guided poles attached on the vertical axis Mounted on the guided pole is a counterbalanced Olympic sized weight bar, attached to two guiding cylinders During squats and heel raises, sturdy metal safety pegs were secured on the Smith machine at individually designated depths to ensure optimal safety For heel raises an 89cm heel raise block (HRB) was used The deadlifts were performed with a standard Olympic bar
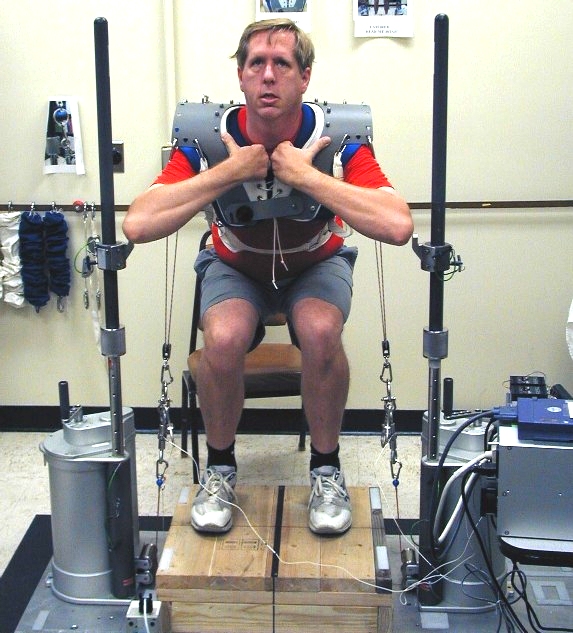
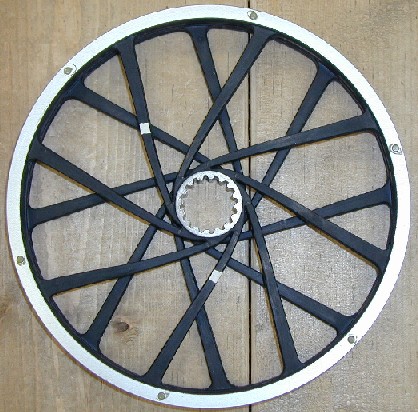
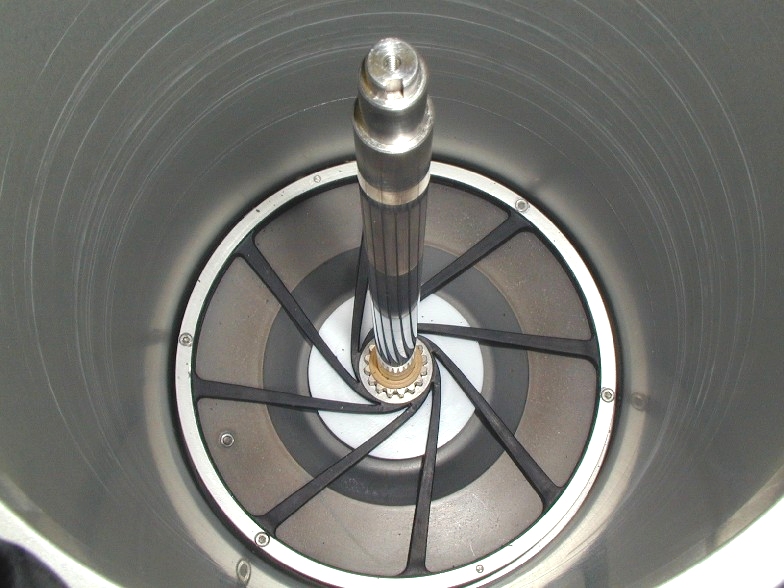
For the first phase groups training with the iRED, the mid- 1RM value was also obtained using the iRED The iRED is a device composed of two independent canisters to allow unilateral and bilateral operations Each canister contains sixteen circular, flex packs connected to a cord Flex-packs consist of an outer aluminum wheel with rubber polymer spokes protruding towards and connecting to a smaller aluminum hub in the center, resembling a bicycle wheel The Flex Packs are lined up top to bottom with a metal shaft running through the aluminum hubs The metal shaft allows the Flex Packs to rotate in unison, while keeping them aligned An Edelrid (Edelrid, Isny im Allgäu, Germany) cable winds around a spiral pulley, which itself is attached to the aluminum hub of the first Flex Pack The distal part of the cable attaches to an egg-shaped stopper to prevent the cord from retracting back inside the device Attached to the stopper is a metal clip that can be clipped to exercise adapters Turning a crank on the outside of the resistance device sets the resistance level As the crank turns, it engages a gear on the inside of the machine, which winds the small aluminum hubs counter-clock wise, generating tension on the rubber polymer spokes to create resistance The hub of the top Flex pack is locked in place on the metal shaft and serves as the anchor while the rest of the Flex Pack stack is rotating Indicator marks on the outside of each canister show the resistance levels being attained while the crank is being turned Once the desired resistance level has been reached, the Flex Packs are locked securely in place by releasing a safety lever located on the side of the machine Dynamic resistance is created during the exercises as the small aluminum hubs are rotated inside the flex-pack, while the outer wheels rotate at a different angular velocity
Lower limb muscles can produce impressive forces Therefore, training of these muscles place high demands on the mechanics and materials of the exercise equipment In order to gain increases in both bone and muscle mass, the device must provide high enough loads (exceeding two times the body weight) to overload the muscles and provide load-bearing stress on the bones (Berg and Tesch, 1992) During life cycle testing it was found that that the flex-packs in the iRED canisters were not reliable when beyond total resistance greater than 136kg for the estimated amount of repetitions during one increment on-board the ISS (~ 52-57 thousand repetitions) For this reason, the load that each canister could provide was limited at 68kg at the maximal cable extension of 56cm Training resistance could be supplemented, if needed, by adding TVIS (Treadmill Vibration Isolation System) bungee-cords in-line with the iRED cables In total, six bungees (3 bungees per side) could potentially be added to augment the resistance created by the iRED Each bungee provided 48kg at full extension of 94cm
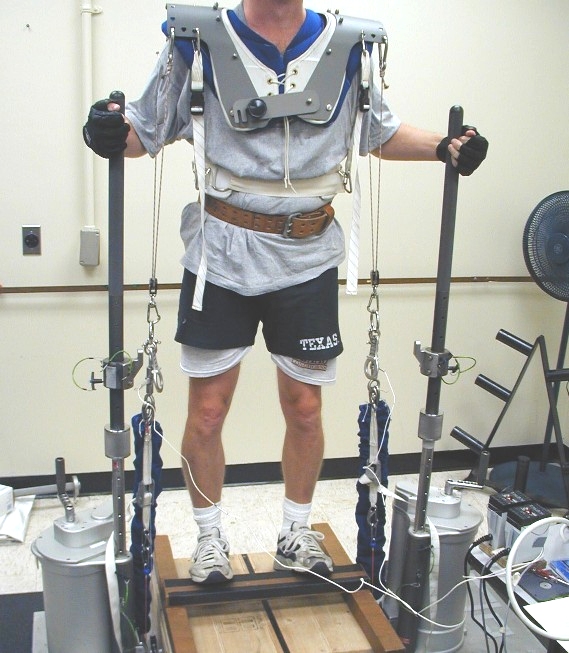
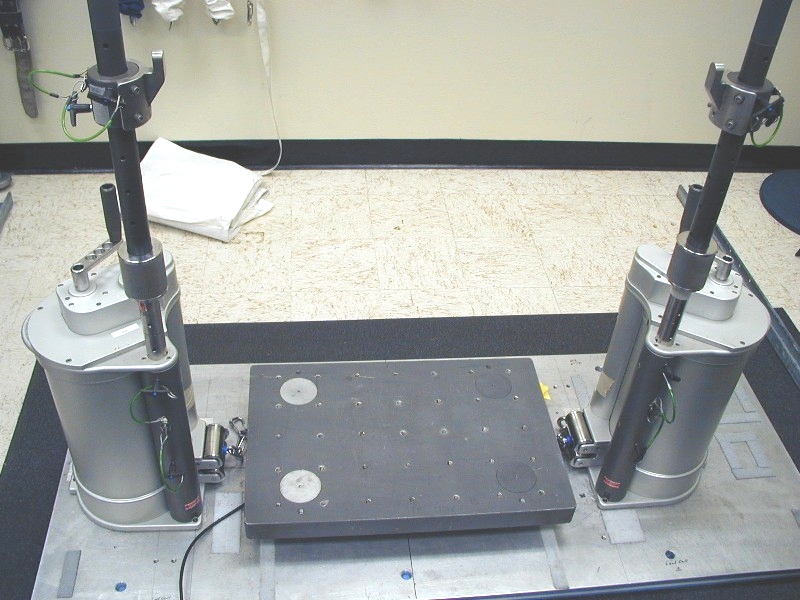
The iRED hardware further consisted of a base plate, to which the canisters were connected, squat support bars that extended above the canisters and associated soft goods Soft goods included a squat harness, a dead lift bar, a heel raise block, extender and safety straps and a series of "French" caribiner clips
|
|
|
|
The Exercises
The squat, heel raise and deadlift were the three exercises that were selected as the training exercises because they form the cornerstone for the American inflight strength-training countermeasure program
The Movement
During the squat exercise, the subjects started with a stance with their feet placed that was approximately shoulder's width apart The barbell was then placed on their upper Trapezius muscle, with care taken not to rest the bar on their spine The subjects hands were placed on the bar such that the elbows were flexed approximately 90-120°, with the subjects wrists in a neutral position Their elbows were below the wrists and their scapula was adducted with their chest held high Their head remained up and back so that a neutral spine position was maintained Their feet were slightly rotated outward to provide a biomechanically efficient position, as well as a safer, more stable base The subject began the squat movement by first flexing the hips, knees and ankles as they leaned their trunk forward until an adequate squat depth was reached At this point, the posterior borders of the hamstring muscles were about parallel to the floor, at approximately 90-110º knee flexion At the bottom of the lowering phase, simultaneous extension of the hips, knees and ankles returned the lifter to the starting position
The deadlift exercise is also a multi-joint, closed kinetic chain exercise (CKC) The subjects started in a fully erect stance (full military position), upon which two spotters provided the barbell The subject grasped the bar with an alternate over and under grip, depending on the subjects dominant hand The grip was lateral to the feet and the feet, were only slightly turned outward. While looking straight ahead, with their spine is in a flat position, ie not bent or arched, the bar was then lowered by bending the waist and knees equally at the same time until an adequate depth was reached The bar was then lifted up in a controlled manner, where the subjects hips and shoulders move at the same rate, keeping back posture straight, and their shoulders above or slightly in front of the bar until the starting position has been reached
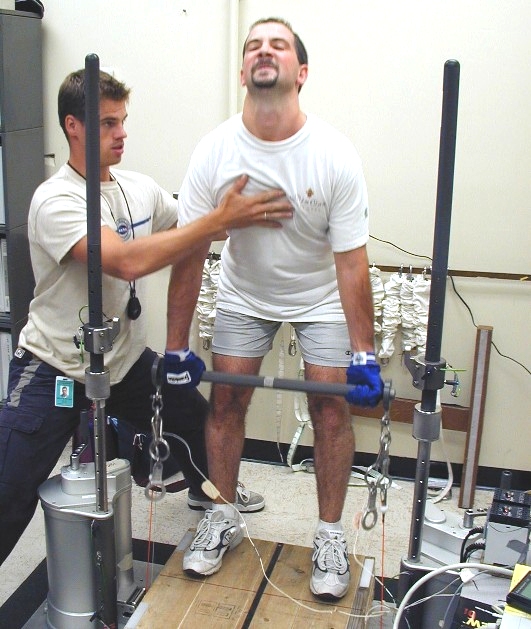
In performing the heel raise exercise, the subjects initially started off standing erect with the balls of their feet on the edge of the heel raise block The bar was then placed on the upper parts of the trapezium muscle, similar to the squat exercise The subjects lowered their heels below the level of the Heel Raise Block until their heels touched the floor Then the subject executed a maximal plantar flexion movement and subsequently returned to the initial position
|
|
|
|
1RM Sessions
Subjects were familiarized with the operation of the Smiths Machine and the deadlift bar in their first 1RM session. During this session, the subject received an explanation of the protocol and the first 1RM values for the three exercises were determined. In order to increase the reproducibility of the 1RM testing procedure, starting position and excursion distance throughout the full range of motion (ROM) for each exercise were measured and used as a target, by using a tape-measure and a linear encoder in-line with the squat bar. To further increase the reliability, the test protocol warm-up procedures were standardized as well as number of repetitions, and rest periods between subsequent 1RM attempts. The subjects warmed up for each exercise by completing two sets of 8 repetitions at a low load ( ~ 28kg). Between successive trials, the subjects were given 3 minutes of rest to minimize the development of fatigue. During the rest periods, the subjects were advised to stretch the appropriate muscle groups. This was followed by 1 set of 3 repetitions at a higher load. The load was progressively, but conservatively, increased and after 3 minutes of rest the subjects attempted another 1RM lift. This procedure was repeated until the subject failed to complete a single lift with either the proper form or a full ROM. The total load of the last successful lift was recorded as the 1RM value.
To increase to accuracy of the 1RM value, 4 separate 1RM sessions were conducted before the beginning of the training program, with at least a 7-day interval between sessions to allow a full recovery. Based on the 1RM data, the subjects were assigned into four groups. At the mid-point of the training period, and after 16 weeks of training, the exercising groups all performed a 1RM session to quantify increases in strength. The control group performed their mid-1RM tests and post-1RM test at 8 weeks and 16 weeks after their last pre- 1RM session, respectively.
In addition to excursion distance, the forces generated by the subjects during the iRED exercises were measured using two load cells, placed in-line with the iRED cables. The peak force for each repetition during the 1RM session on the iRED was recorded and used for statistical analysis.
16-Week Training Protocol
The 1RM value was considered to be the "gold-standard" as measure of strength and its value was used to determine the intensity of the 16-week progressive training program. Training was performed 3 days per week and consisted of three exercises (squat, heel raises and deadlifts). For all exercising subjects the intensity of the resistance program was determined using a percentage of the individuals 1RM value for the first 3 weeks of training. The intensity progressively increased by 10% at the beginning of each new training week from 50 to 70%. Also, during the first three weeks, the warm up for each of the three exercises consisted of one set of 10 repetitions at approximately 25% of the 1RM value. Starting with the fourth training week, a weekly cycle was started and continued throughout the rest of the training period. The warm up, then, consisted of one set of 10 repetitions at approximately 50% of the 1RM value. The three intensities of the weekly cycle were now set as the maximum load that could be lifted for a given number of repetitions for each exercise. Subjects exercised at 6-8 RM at the high load day, 10-12 RM at the low load day, and 8-10 RM at the medium load day, respectively representing approximately 83%, 73% and 78% of the pre-training 1RM value (Heyward, 1998). The loads were then changed accordingly throughout the remainder of the training sessions.
Missed Sessions
Due to unforeseen hardware problems with the iRED during the first phase of the study, the subjects training on the iRED missed some of their training sessions. Since the goal of this study was to compare the effects of the training protocol using the iRED to that of free weights, the training stimulus was equated by providing the same number of missed training sessions for all exercising groups. For both practical and funding-related reasons the training period was not extended. For this reason an attempt was to make up for the lost training sessions in the weeks following the weeks in one or more missed sessions, through the use of a standardized protocol. The protocol consisted of four training sessions within one week instead of three. Subjects trained on two contiguous days, then had one rest day. The subjects then trained again on two contiguous days. The first session of these weeks was a high intensity day, followed by a light intensity day, and then two medium intensity days. This protocol was followed by a regular training week to prevent injuries from potential overtraining.
TVIS (Treadmill Vibration Isolation System) Series Bungees
During periods when the IRED was not operational, the subjects trained using up to TVIS (Treadmill Vibration Isolation System) bungees. Each bungee is constructed of three strands of latex rubber in parallel, covered with a Nomex sock, and has the capability of providing approximately 48kg of peak load at a full extension (94 cm). This was called the CRES (Contingency Resistive Exercise System). The bungees were used to provide all loads to the subjects.
Other times, the TVIS bungees were used along with the iRED to augment (AUG) the load than could be generated by the iRED alone. CRES was designed to support the three exercises of the study: squats, deadlifts, and heel raises.
Mid- and Post-training Testing
During the training period, the loads were progressively adjusted. A 20% reduction in all training intensities was implemented one week before the mid-1RM and post-training 1RM sessions. Subjects during the first phase of training with the iRED performed 1RM tests in the 9 th and 10 th week, and after 16 weeks of training, using both free weights and the iRED to evaluate differences in 1RM values as a consequence of training. After the first phase of the study it was concluded that the iRED was not suitable for 1RM testing and therefore was discontinued for the second phase. At all times during testing and training sessions, three test operators per subject were present in the exercise room.
Data Acquisition Equipment
The data acquisition system is depicted in Figure 3. Force was measured using two PS-30 powered load cells (Entran Sensors & Electronics, Fairfield, NJ, USA) that were connected inline with the iRED cables and/or TVIS bungee cords. The full ROM for each exercise was measured using a linear encoder (Ergotest Technology, Langesund, Norway), which was also connected inline with the iRED cables and/or TVIS bungee cords. The output from the linear encoder was connected to an electronic decoder (Fernando Figueroa, Tulane University, LA, USA). Both the force and ROM data were recorded using a Compaq Armada notebook computer (Compaq Computer Corporation, Houston, TX, USA) along with a National Instruments SCXI data acquisition system (National Instruments, Inc., Austin, TX, USA). This system was controlled by a set of programs written in LabVIEW version 5.1. For subjects training on free-weights, only the ROM was measured and recorded using this system, i.e. no load cells were used.
Calibration Procedures
The iRED, load cells, and linear encoder were calibrated once per week throughout the 16-week training study.
Load Cell Calibration
The load cells were placed on a flat surface and data was recorded for approximately 10-20 seconds. The load cells were then suspended from a caribiner secured to an elevated bar. Calibrated weights (Cybex International Inc., Medway, MA, USA) were suspended from each load cell in 25kg increments up to 100 kg total, and data was recorded for 10-20 seconds at each increment. The raw voltage output from the load cells at each increment was compared to the known load suspended from the load cells using a linear regression, with voltage as the independent variable and the known load as the dependent variable. The parameters calculated by the regression analysis were then entered into the LabVIEW programs, which then converted the load cell voltage into the appropriate load.
Linear Encoder Calibration
With the linear encoder cable completely retracted, data acquisition was started. Every five seconds, the linear encoder cable was extended in five-inch increments until 88.9cm of cable extension was reached, at which point data acquisition was halted. The raw output from the electronic decoder was then compared to the known cable extension (in cm) using a linear regression, with the decoder output as the independent variable and the known cable extension as the dependent variable. The parameters calculated by the regression analysis were then entered into the LabVIEW programs, which then converted the decoder output into the appropriate cable extension.
iRED Calibration
Following load cell and linear encoder calibration, each iRED canister was independently calibrated by performing one set of five single-canister deadlifts at each resistance indicator mark. Each deadlift was performed by consistently extending the iRED cable from 0 to 56cm. The rate of cable displacement was held constant at ~ 28 cm/s by pacing the exercise motion to an audible metronome. At each indicator mark, the peak load of each repetition was measured and the average peak load for the set was calculated and recorded into a table, which was then used to determine the appropriate indicator setting for each subject during the training sessions. Since the temperature of the polymer material in the flex-packs increases with usage, the resistive characteristics of the flex-packs change; therefore, the calibration procedure was completed prior to any training session on calibration days.
Magnetic Resonance Imaging (MRI)
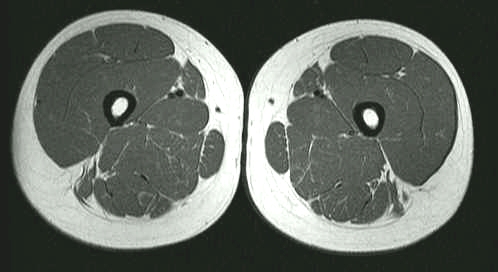
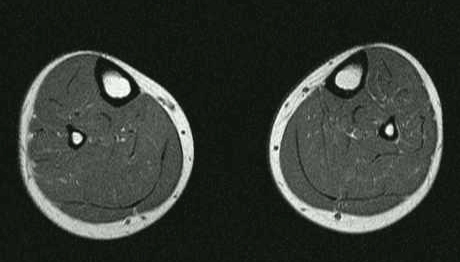
Magnetic resonance imaging provides excellent, noninvasive images of soft tissues (Cerretelli and Binzoni, 1997). The purpose of the MRI sessions during this study was to evaluate changes in muscle volume with iRED and free weight training (Fleckenstein et al., 1991; Cerretelli and Binzoni, 1997). To effectively analyze this data, muscles were grouped into calf and thigh muscles.
MRI data was obtained by Baylor College of Medicine at Methodist Hospital in Houston, as well as the Clear Lake Regional Hospital, using a GE 1.5 Tesla unit (General Electric Company, Waukesha, WI, USA). The spin echo for the volumes had an echo time (TE) of 14ms and repetition time (TR) of 800ms.
An MRI technologist positioned the subjects in a supine position on a specific MRI table. A surface or image coil (body coil) was positioned around the region of interest. The padded table then moved slowly into the cylindrical magnet opening. To control the fluid shift caused by lying supine after standing upright (LeBlanc et al., 1995), the subjects were recumbent for approximately 10 minutes before the start of the data acquisition.
Because MRI images are very sensitive to movement, the subjects were asked to remain relaxed, and still for each scan period of approximately 3 ½ minutes. During image acquisition, the feet were positioned in a holding device to minimize movement and to ensure repositioning (LeBlanc et al., 1995).
Both limbs were imaged simultaneously. The image matrix was 512 by 512; the field of view was 400mm by 400mm for the thighs and 300mm by 300 mm for the calves. The MRI images taken of the thigh consisted of 32 contiguous images at 10mm intervals. The muscle volume analysis was accomplished using a combination of routines from the image analysis program Khoros (Khoral Research Inc., Albuquerque, NM) and routines written in the Baylor College of Medicine MRI Laboratory. There were two steps in the muscle volume analysis. The muscle was first separated from other elements of the image (mostly fat and bone), and then the anatomical position of each slice was determined so that the volumes calculated at two different times could be compared.
The first step was accomplished by extracting one leg for the larger image, normalizing the image to correct for the different body coil sensitivities, thresholding the image to select only pixels that contain muscle, and finally manually excluding any areas that are not part of the leg muscle (typically contributions from the other leg). The anatomical position was determined by measuring the area of the marrow in the tibia or femur for each slice. Since the marrow produces a very bright signal that is surrounded by the very low signal from the bone, the analysis was to some extent automated.
The total muscle volumes of the calf and the thigh were calculated from the cross-sectional data using a trapezoidal technique (LeBlanc, personal communication). This technique involves integrating the area under the curve of muscle area vs. position along the leg. This technique was chosen to account for the imperfect alignment of the images from one session to the next. The areas of each slice were added and multiplied by the separation, and interpolated at the end of the regions. Since the regions were determined by locating optimal images rather than the "true" ends of particular muscles, absolute volume measurements were not meaningful. However, for each subject, muscle volumes were determined over the same anatomical region for the pre-training and the post-training scans and percent change was determined.
|
|
|
Dual-Energy X-ray Absorptiometry (DEXA)
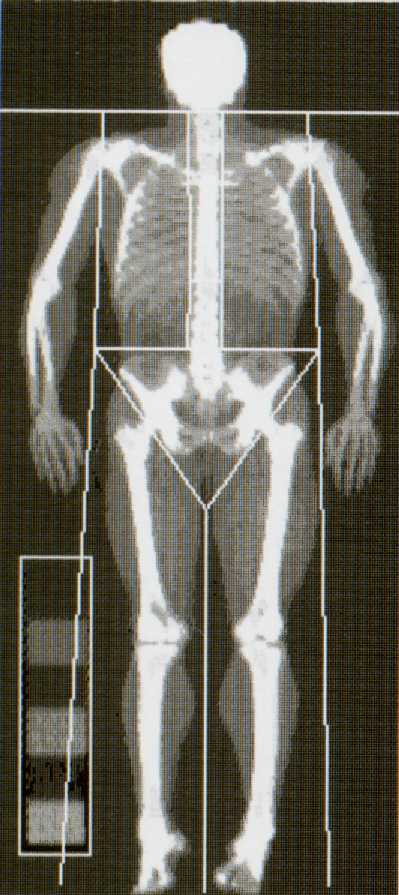
DEXA is a noninvasive technique that employs low-dose x-rays (LeBlanc et al., 1998) to obtain images and is used in the Bone and Mineral Laboratory at the NASA Johnson Space Center. In this study, DEXA was used to determine whole body, left femoral neck and lumbar spine bone mass. The Hologic Inc. 4500 ELITE series fan-beam X-ray Bone Densitometer (Bedford, MA) uses a multi-element detector array and a fan-beam geometry to estimate bone quality (Garber et al., 2000), i.e. Bone Mineral Content (BMC) and Bone Mineral Density (BMD). BMC is the total quantity of bone material that is measured by DEXA, usually in grams. BMD is calculated using a linear equation, which divides the BMC by the area of the region examined and is expressed in grams/cm 2 . DEXA was also used for body composition analysis to determine muscle mass, lean body mass (muscle mass and BMC), and percentage of body fat.
An anthropomorphic spine phantom with a known mineral content was first scanned as part of a quality control measure to ensure system precision. In total, 18 scans were obtained in 6 sessions, with 9 scans obtained before the training period in three sessions and 9 scans were obtained after the training period in order to get a more accurate estimate of the BMD, BMC, and body composition. In every session, one whole body scan, one left femoral hip scan, and one lumbar spine scan were obtained.
During the whole body scan, the subject lay in a supine position on the examination table and was centered prior to the scanning. Their hands were rotated inwards and placed on the table in such a way that they were included the field of view. Their feet were loosely strapped to increase stability.
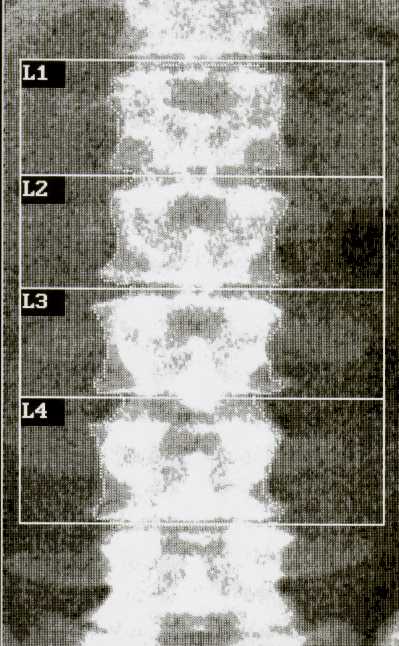
During the lumbar spine scan the subject was in a supine position and was positioned straight on the examination table. A large square cushion was placed under the subjects lower legs so that their femur was as vertical as possible. This procedure flattens the spine and improves the field of view of the examined vertebrae.
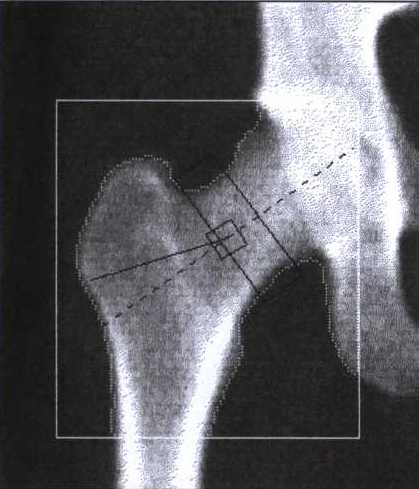
During the left femur scan, the subject was again in the supine position on the examination table and their feet were placed on the hip scan-positioning fixture. The center of the fixture was aligned with the subjects mid-line. The examined leg was abducted, rotated inwards to approximately 25 ° , and strapped to the positioning fixture to immobilize the foot during data acquisition.
During all scans the subjects were instructed to remain relaxed, and still. The total body scan took six minutes, the lumbar spine and left femur scans each took one minute.
On each image, the edge and baseline of each regions of interest and associated sub-regions were outlined by the test operator. The total body, lumbar spine, and femoral neck BMD and body composition (whole scan only) measurements were obtained by the manufacturers analysis software v 10.0.
|
|
|
|
Figure 5. Examples of DEXA scans. Whole body, lumbar spine, and hip, respectively, with regions of interest outlined by the test operator.
All measurements of any one subject were obtained and analyzed by the same test operator.
Statistical Analyses
The statistical evaluation of the data was accomplished using a General Linear Model analysis of variance (ANOVA) with repeated measurements to detect differences between pre-, mid-, and post-training within and between the groups. When appropriate, Tukeys post hoc tests were used for pair-wise comparisons. All statistical analyses were performed using Statistica (Statsoft, Tusla, OK, USA). Statistical significance was defined as P £ 0.05.