LSO

|
|
LSO
|
|
Abstract:
The experiment LSO is dedicated to
the optical study, from the International Space Station, of sprites occurring
in the upper atmosphere above thunderstorms.
The experiment uses two micro cameras. One observe the
whole of the visible spectrum and locate lightning flashes and sources of thunderstorm
activity. The
other is equipped with a moderately wide band filter at 761 nm. This filter
includes the most intense N2 1P emission of the sprites and partly the oxygen
absorption A band of the atmosphere. This camera is used to observe the sprites,
produced in the upper atmosphere and differentiated from lightning, which occur
more deeply in the atmosphere and are then more absorbed.
The objectives are to validate a new measurement concept for future measurements
of sprites from space at the nadir and to perform statistics about the global
spatial and temporal distributions of the sprites and their seasonal variations.
Address corresponding
author:
PI : E. Blanc. Commissariat ŕ l'Energie Atomique (CEA), Bruyeres
le Chatel, France E-mail:
elisabeth.blanc@cea.fr
Co-Investigators
(all TNO-Human Factors):
Co-I : T. Farges(1), R. Roche(1),
D. Brebion(1), With the participation of A. Labarthe (2)
and V. Melnikov(3)
(1) Commissariat ŕ l'Energie Atomique (CEA), Bruyeres
le Chatel, France
(2) Centre National d’Etudes Spatiales, 18 av. Edouard Belin, 31055 Toulouse, France,
(3) Rocket Space Corporation ENERGIA, 141070, Lenin St., 4A, Korolev, Russia.
Introduction:
Sprites are a meteorological phenomenon discovered in 1989, which have the appearance
of a luminous glow above lightning storms between 50 and 90km above the Earth’s
surface. Sprites have duration of few to several hundreds of milliseconds and
are caused as a result of powerful lightning strikes, which affect the electrical
field in the ionosphere.
Sprites are observed from space (Boek et al., 1995), from planes (Sentman et
al., 1995) and from the ground (Winkler et al., 1996). Observations are always
performed at large distances at the horizon where sprites are spatially differentiated
from the lightning flashes. Figure 1 shows an example of sprite
measured in Europe by Neubert et al., (2001).
The mechanisms at the origin
of sprites are still in discussion. Sprites could be produced by relativistic
runaway electrons triggered by cosmic radiation (Roussel Dupré et al., 1998).
The light emission associated with sprites could then be only a part
of more complex phenomena implying a high energy electron beam injected in the
ionosphere and in the magnetosphere with electromagnetic radio emissions in
a very large frequency range associated with X-gamma emissions.
Simultaneous measurements from space of the electromagnetic and particles emissions
associated with sprites needs however nadir observations, never performed until
now.
Measurements from space at the nadir are difficult because the light emissions
of sprites are superimposed on the intense light emissions of the lightning
diffused by clouds. The experiment LSO proposes
an original method to perform a spectral differentiation of sprites and
lightning at the nadir.
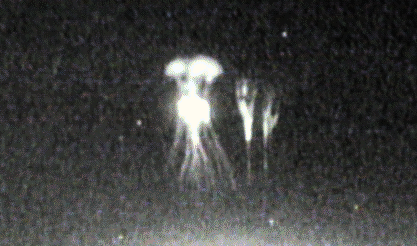 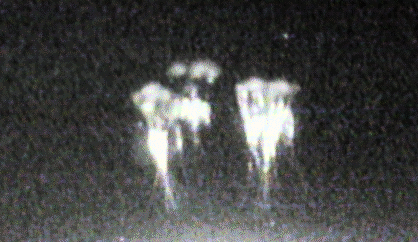
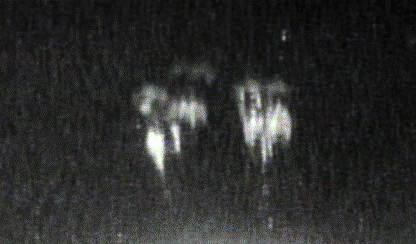
Figure 1 : Example of sprite observed from the ground in Europe (Neubert et al., 2001). |
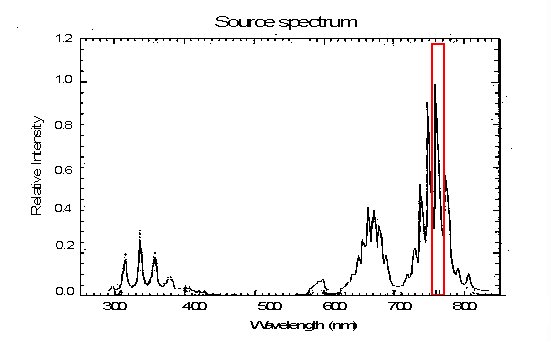
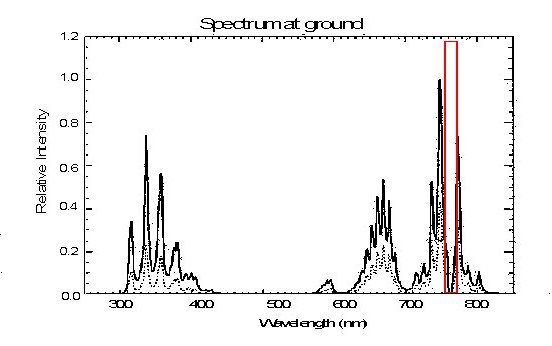
Measurement concept: The
frequency band, proposed for the selective spectral measurements of sprites,
corresponds to the most intense sprite emission band : the N2 1P line
at 762 nm. A theoretical spectrum of sprite is presented in Figure 2 (Milikh
et al., 1998). The interest of this spectral band is that it is very close to
the absorption band of the dioxygen near 760.8 nm.
For this reason, the sprite emission line N2 1P does not appear on the sprite
spectra at the ground (Figure 2, bottom), where the dioxygen density is important.
At the contrary, it will be observed from space because the sprites are produced
in the altitude range 30-100 km where the dioxygen concentration is low. The
other light emissions from ground and lightning produced in the lower atmosphere
will be absorbed.
|
|
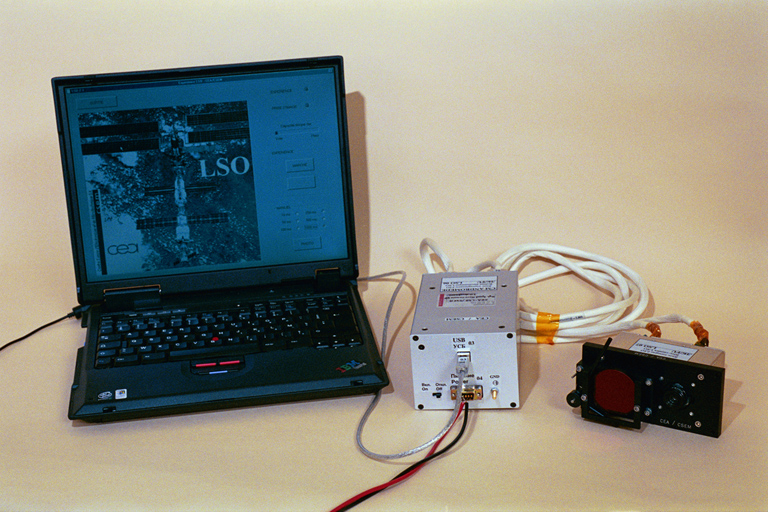
Experiment
description: The
LSO experiment is already on board of ISS. The experiment was developed
by the Commissariat ŕ l’Energie Atomique with the participation of the Centre
National d’Etudes Spatiales in the frame of the mission Andromede. Other measurements
were obtained in the frame of other taxi missions organized by the European
Space Agency (Odissea, Cervantes), and in the frame of a collaboration with
Russia. Measurements are realized with the collaboration of RSC Energia (Russia).
The experiment uses two digital
space micro-cameras: 512x512 pixels CCD, 10 bits dynamic, field of view
: 39°. One observe the spectrum in the visible and near Infra Red, the second
camera is equipped with a filter for the sprite observations. The images of both cameras are taken simultaneously, the time exposure is
1s. Both cameras are controlled by an electronic unit
linked to a PC through its USB port (Figure 3). The transmission of both images
takes 5 seconds.The cameras are fixed at an ISS window. The experiments are programmed by the astronaut
at the beginning of the experiment and are then automatic. The measurements
are performed during night-time, mainly over continents were most of the storms
are expected. Data are automatically acquired and archived
on the ISS. On the ground, data are processed to search for lightning and sprites
and analyse their characteristics. Correlations will be made with data from
other experiments, including ground measurements and satellite observations
of storms and lightning flashes.
|
|
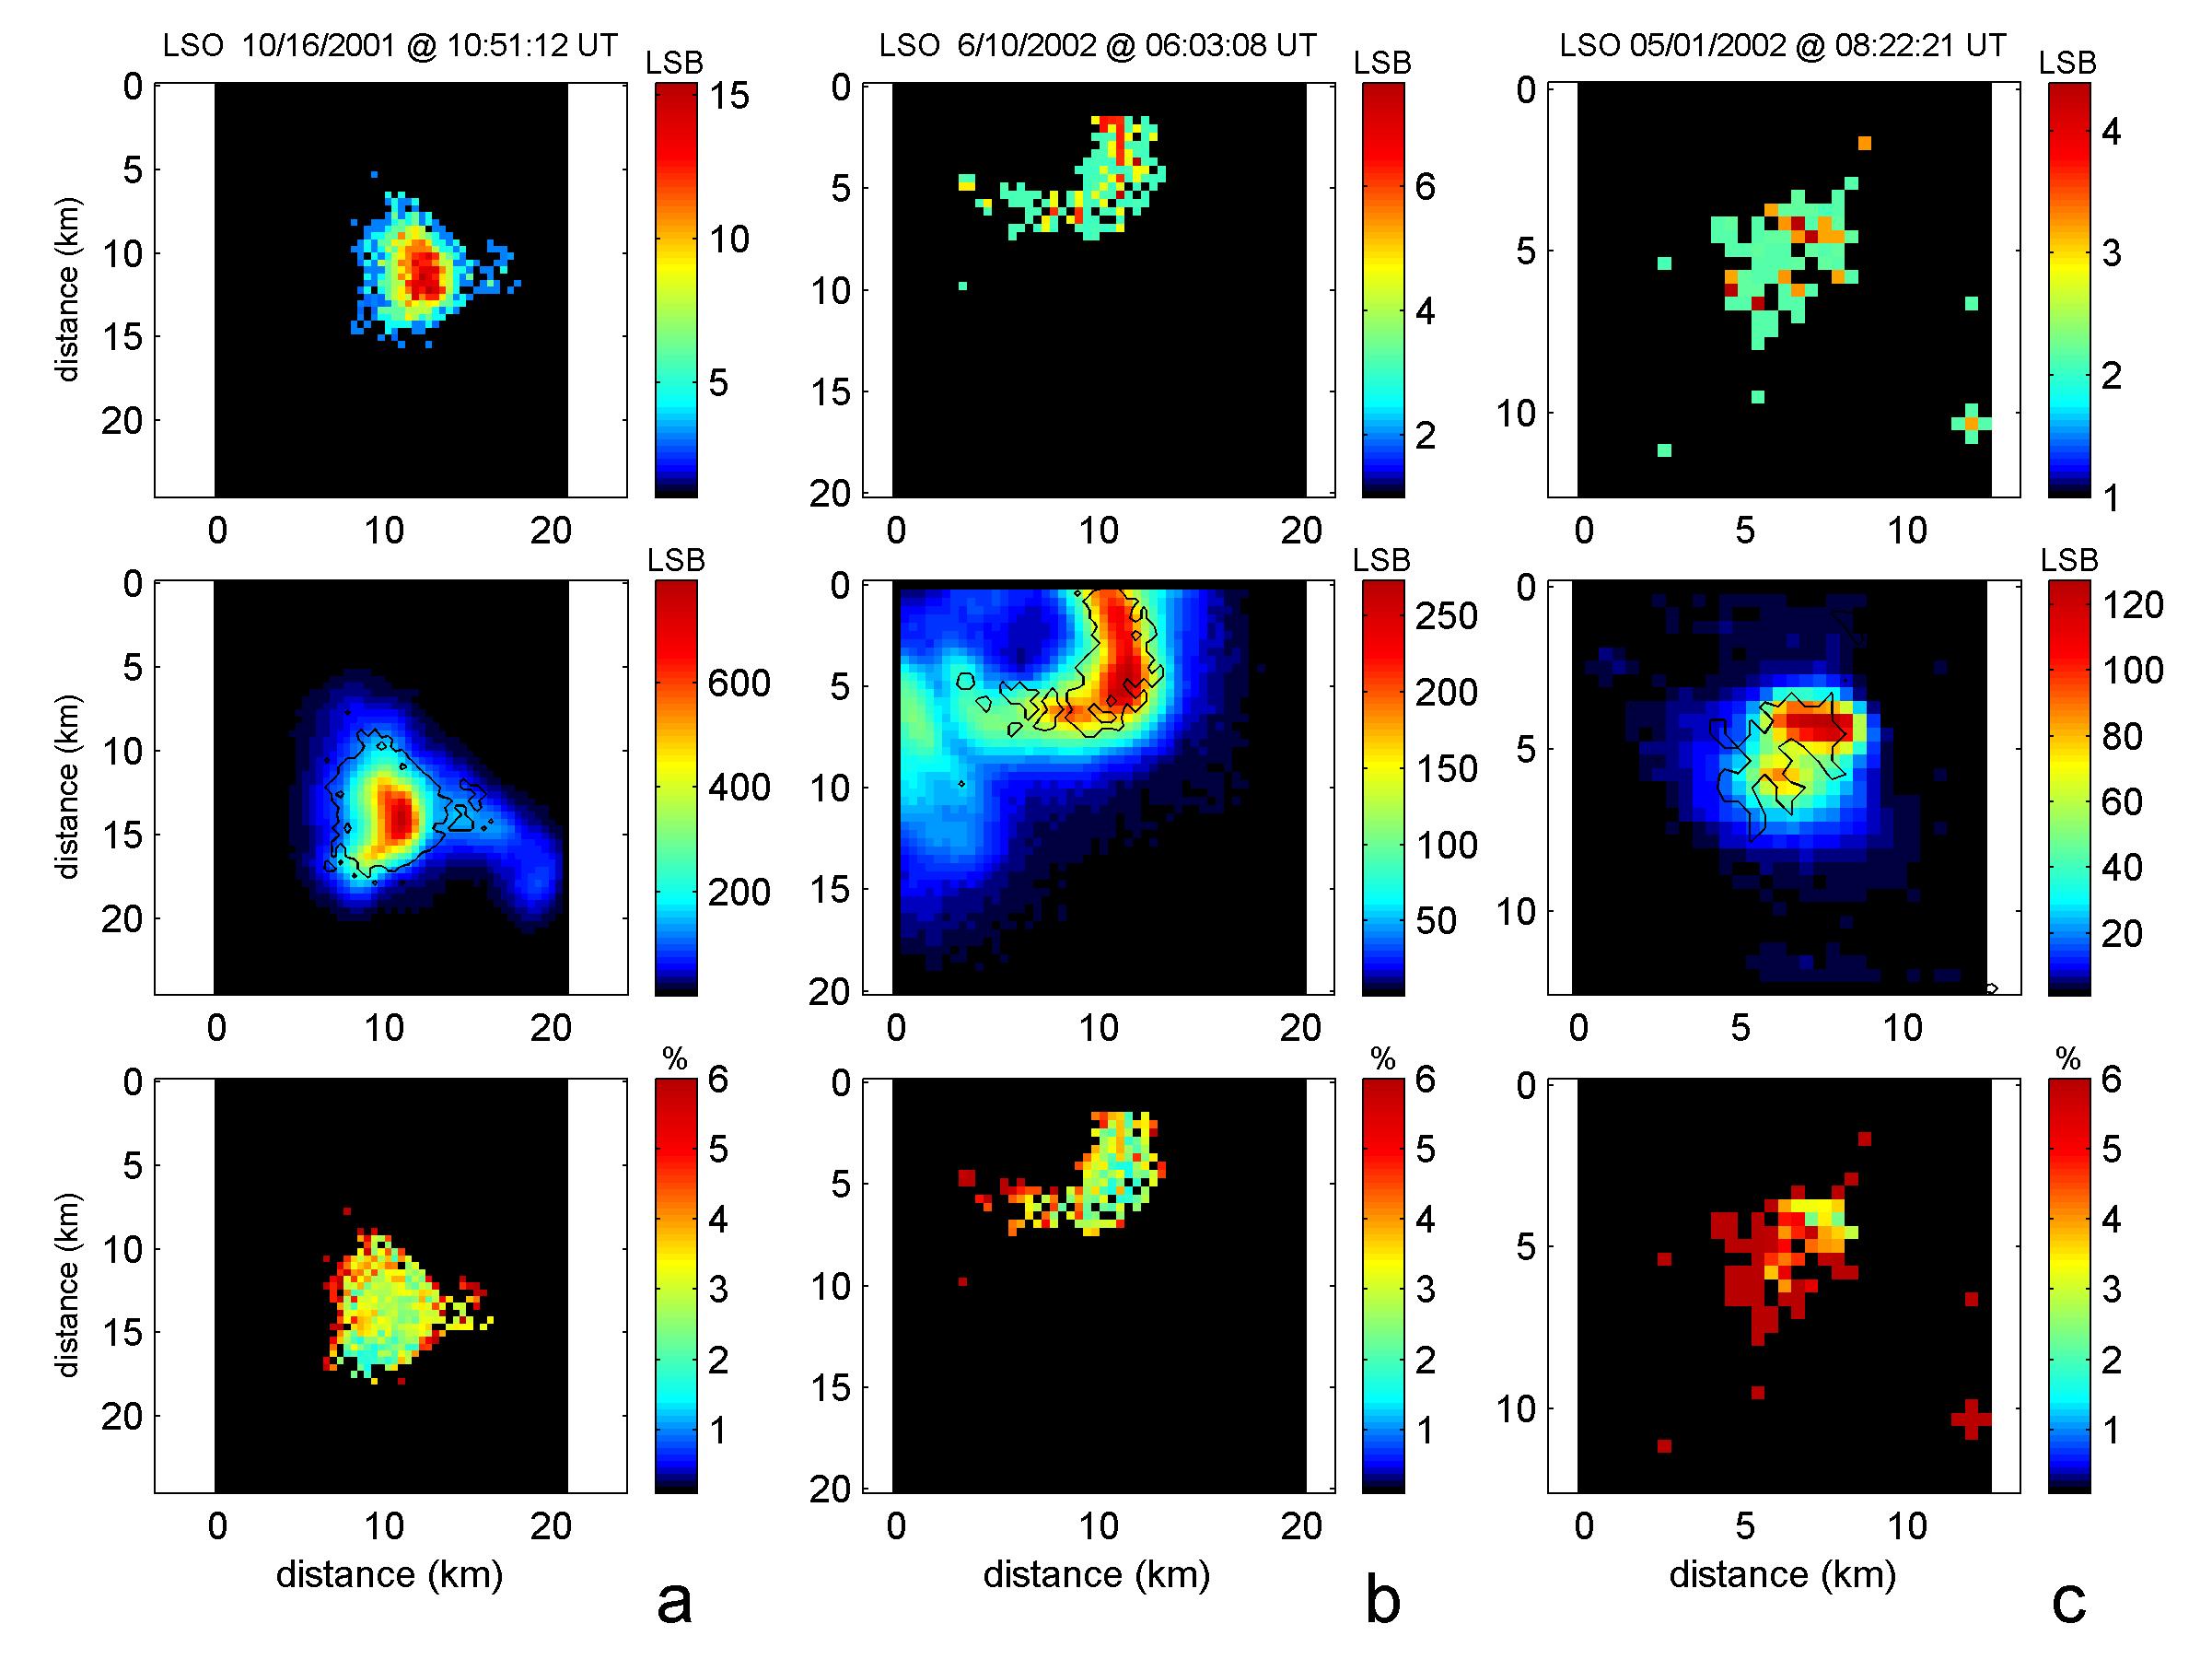
LSO results: At the end
of the Odissea mission, LSO observed 60 transitory events with the camera in
the visible and near infra red and 13 events with both cameras.
An example of transitory event, recorded by both camera on October 16th
2001 at 10:51:13 UT while ISS was moving toward Japan, is shown in Figure
4 (left). The ratio of the intensities received by both cameras is about 3 to
5%. The event was correlated by lightning activity measured at ground by the
Japan Lightning Detection Network.
This example illustrates the class of sprite events defined by a ratio of both
camera intensities, higher than 3%. Another example is shown in the center part
of the figure. Ten events belonging to this class were identified.
A second class of lightning events is defined by a lower intensity ratio
of both camera intensities of about 1%. Only three events of this class were
observed. One example is shown in the right part of Figure 4.
A comparison of LSO data with the LIS data of the TRMM mission (Christian et
al., 2003), available on the NASA Web site (2002) showed that the LSO observed
the most intense lightning corresponding to about 25% of the LIS lightning flashes.
A comparison with the observations reported by Turman (1977) showed that the
lightning events detected by both LSO cameras belong to the class of the intense
superbolts with a power of about 1011 to 1012 W. Only
about 1% of lightning belong to this lightning class.
|
|
Benefits
of this research: Up
to now, 180 lightning flashes were observed by LSO and 15 sprites were identified.
Within five experiment days, about 60 lightning are observed in average and
about 5 sprites. The ratio of the intensities of both cameras is variable from
a sprite to another, it reached values of about 10 in recent observations. At
the contrary, the ratio observed for lightning is always about 1%. On
the LSO data, 15 sprites were observed on a surface of 200x200 km within 19
hours of effective measurements over continents. During these 19 hours, about 1000 lightning occured, according LIS statistics.
This corresponds to 1,3 sprites for 100 lightning flashes. This
value is in agreement with the values generally given of 1 sprite for 100 to
500 lightning, even if the number of effective observation hours of LSO is still
low for reliable statistics. It is necessary to obtain additional measurements
to validate these first statistics.
The results obtained up to now are very encouraging. They allow validating the
measurement concept of sprite observations at the nadir.
This measurement concept will be used by the microsatellite Taranis
(Tool for the Analysis of RAdiation from lightNIng and Sprites) submitted to
the Myriade microsatellite program of the CNES. Taranis is dedicated to the
study of sprites and associated phenomena and to the global analysis of the
coupling between the atmosphere, the ionosphere and the magnetosphere in relation
with these phenomena.
Related articles:
Boeck,
W. L., O. H. Vaughan, Jr., R. J. Blakeslee , B. Vonnegut, M. Brook, J. McKune,
J. Geophys. Res., 100, 1465-1475, 1995.
Christian, H.J., R.J. Blakeslee, D.J.
Boccippio, W.L. Boeck, D.E. Buechler, K.T. Driscoll, S.J. Goodman, J.M. Hall,
W.J. Koshak, D.M. Mach, M.F. Stewart, J. Geophys. Res. , 108, D1, 4005, 2003.
Milikh, G., J. A. Valdivia, K. Papadopoulos, J. Atmos. Terr. Phys., 60, 907-915,
1998.
NASA web site http://ghrc.msfc.nasa.gov, LIS data are produced by the NASA
LIS/OTD Science team, available from the Global Hydrology Resource Center, 2002.
Neubert, T., T. H. Allin, H. Stenbaek-Nielsen, E. Blanc, Geophys. Res.
Lett., 28, 18, 3585-3588, 2001.
Roussel Dupré, R., E. Symbalisty, Y. Taranenko, V.
Yukhimuk, J. Atmos. Terr. Phys., 917-940, 1998.
Sentman, D. D, E. M. Wescott, D. L. Osborne, D. L. Hampton, M. J. Heavner, Geophys.
Res. Let., 22, 1205-1208, 1995.
Turman, B.N., J. Geophys. Res., J. Geophys. Res., 82, 2566-2568.
Winckler, J.R., W.A. Lyons, T.E. Nelson,
R.J. Nemzek, J. Geophys. Res., D3, 6997-7004, 1996.
Publications
about LSO results
Blanc, E., T. Farges, R. Roche, D. Brebion, T. Hua,
A. Labarthe, V. Melnikov, Lightning and Sprites observations on board of the
International Space Station,
J. Geophys. Res., 109, A02306, doi:10.1029/2003JA009972, 2004.
E. Blanc, T. Farges, R. Roche, D. Brebion, T. Hua, Lightning
and sprites observations on board of the International Space Station, Proceedings of the International Conference of Atmospheric Electricity,
2003
European Geophysical
Union, 2003, Nice, France
T. Farges, E. Blanc, Is there a sprite signature in
the lightning data of LIS? A comparison of the LSO and LIS data.
E. Blanc, T. Farges, R. Roche, Lightning and sprite observations on board of
the International Space Station
European Geophysical Society,
2002, Nice France
E. Blanc, T. Farges, R. Roche, Lightning and sprite
observations on board of the International Space Station
International Union of Geophysic
and Geomagnetism (IUGG) 2003, Sapporo, Japon
E. Blanc and the Taranis team, The microsatellite
project Taranis
COSPAR 2002, Houston, USA
E. Blanc, T. Farges, R. Roche, D. Brebion, T. Hua Observations
of Lightning and sprites at the nadir from the International Space Station
International Union of Radio
Science (URSI) 2002, Maastricht, Netherland
E. Blanc, T. Farges, R. Roche, Lightning and sprite
observations on board of the International Space Station
Acknowledgements:
The authors would
like to thank the astronauts C. Haigneré (F), V. Korzun, (Ru), Yu. Onufrienko
(Ru), V. Dezhurov (Ru) and F. de Winne (B) for their participation in the measurements.